Weather Maps
| |||
On your Weather Map Activity Sheet, answer the following questions:
Weather Map Directions:
1) Using the link provided on my wiki, and the US: Current Weather map, draw the different fronts and pressure systems onto the US map above. Be sure to use correct colors!
2) From the thumbnails below the Current Weather map, choose the US: Doppler Radar map. Add the precipitation to your map above. Be sure to use correct colors!
3) Click on the US: Current Temperatures map from the thumbnails. Add at least 10 temperatures onto your map above. Make sure to include some temperatures on each side of the fronts.
4) Add the date and current time in the blanks above.
Analysis: (Use your notes to help you, if needed!)
1) What type of fronts are on your weather map and where are they located?
2) What kind of weather would you EXPECT to see with each of these fronts?
3) What kind of weather do you ACTUALLY see near the fronts? (Be specific – which weather for which front?)
4) What type of pressure systems are on your weather map and where are they located?
5) What kind of weather would you EXPECT to see with each of these pressure systems?
6) What kind of weather do you ACTUALLY see near the high and low pressures? (Be specific – which weather for which pressure system?)
7) Where are the warmest places on the map?
8) Where are the coldest places on the map?
9) If weather systems generally move from west to east, what type of weather can North Carolina expect later today or tomorrow, based on the weather map?
10) Why is it difficult to predict the weather?
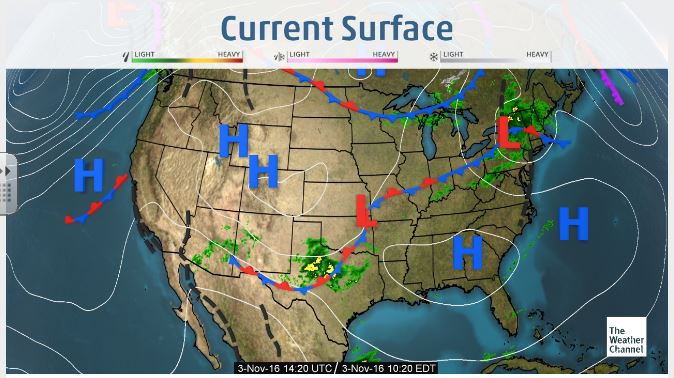
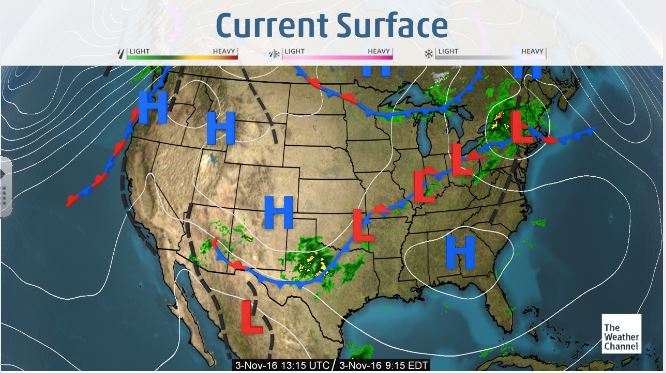
Look below for the weather maps to use for this activity. Make sure you are using the map for YOUR class!!
Weather Map Directions:
1) Using the link provided on my wiki, and the US: Current Weather map, draw the different fronts and pressure systems onto the US map above. Be sure to use correct colors!
2) From the thumbnails below the Current Weather map, choose the US: Doppler Radar map. Add the precipitation to your map above. Be sure to use correct colors!
3) Click on the US: Current Temperatures map from the thumbnails. Add at least 10 temperatures onto your map above. Make sure to include some temperatures on each side of the fronts.
4) Add the date and current time in the blanks above.
Analysis: (Use your notes to help you, if needed!)
1) What type of fronts are on your weather map and where are they located?
2) What kind of weather would you EXPECT to see with each of these fronts?
3) What kind of weather do you ACTUALLY see near the fronts? (Be specific – which weather for which front?)
4) What type of pressure systems are on your weather map and where are they located?
5) What kind of weather would you EXPECT to see with each of these pressure systems?
6) What kind of weather do you ACTUALLY see near the high and low pressures? (Be specific – which weather for which pressure system?)
7) Where are the warmest places on the map?
8) Where are the coldest places on the map?
9) If weather systems generally move from west to east, what type of weather can North Carolina expect later today or tomorrow, based on the weather map?
10) Why is it difficult to predict the weather?
Look below for the weather maps to use for this activity. Make sure you are using the map for YOUR class!!
|
1st Core
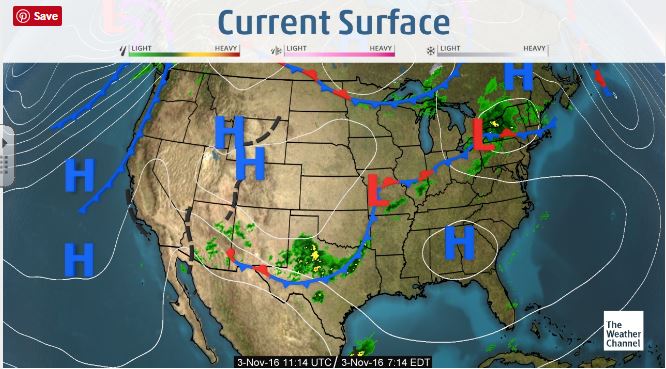
3rd Core
|
2nd Core
|
If you get done early, give this game a try: NASA: Wild Weather Adventure. (Good luck!!)
